
Utility damage data is often used to answer a straightforward question: How many damages occurred?
That number matters. But on its own, it doesn’t tell utility leaders much about what needs to change.
The real value comes from looking beneath the total to understand where damages occur, what infrastructure is involved, which incidents have the greatest consequences, and what patterns continue to repeat.
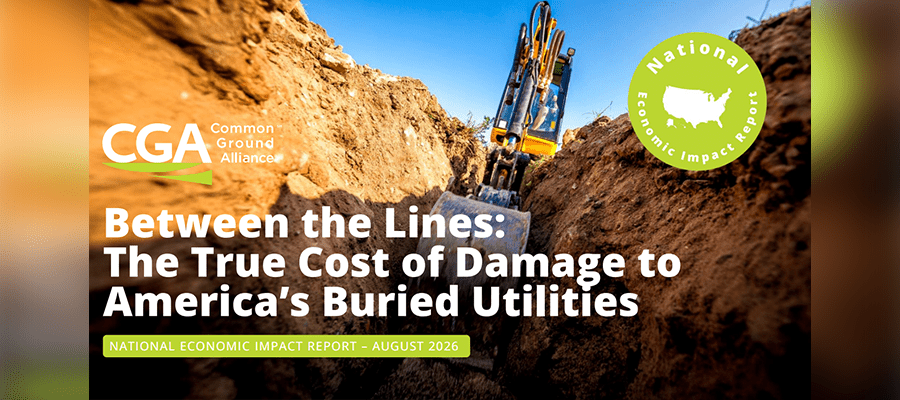
The Common Ground Alliance’s (CGA) new Between the Lines: The True Cost of Damage to America’s Buried Utilities report demonstrates what becomes possible when we look at damage data differently. Rather than treating every incident the same, CGA evaluated damages based on factors including utility type, severity, and location to develop a more complete picture of their impact.
For utilities, there’s a lesson in that approach. Counting damages tells us what happened. Understanding the patterns behind them can help determine what to do next.
Not All Damages Are Equal
A damage count treats every incident as one. Operationally, we know that’s rarely the case.
A telecommunications line damaged in a residential neighborhood presents different challenges than a natural gas line struck along a busy urban corridor. An incident resolved without a service interruption is different from one requiring emergency response, road closures, or extended restoration.
CGA’s analysis accounts for these differences by considering utility type, severity, and urbanicity, recognizing that different facilities and environments create different repair, response, and community impacts.
Utilities can apply a similar mindset to their own data. Instead of looking exclusively at the total number of damages, ask what those incidents have in common.
Look for the Patterns Behind the Numbers
Damage reports, locate tickets, quality reviews, and field observations can reveal trends that aren’t apparent when incidents are reviewed individually.
Knowing that a utility experienced 50 damages provides a benchmark. Knowing that many occurred in the same area, involved the same excavation method, or happened during unusually high-ticket volume provides something more useful: a place to start asking why.
Consider questions such as:
- Where are damages concentrated?
- Which facility types are most frequently involved?
- Are certain excavation methods or projects associated with more incidents?
- Are there patterns related to ticket volume, seasonality or workload?
- Which incidents create the greatest operational or customer disruption?
Together, these indicators can begin turning damage reporting into damage intelligence.
Consider Frequency and Consequence
CGA’s findings also demonstrate why frequency shouldn’t be considered in isolation.
Telecommunications facilities accounted for the largest share of modeled 2025 damages at 47.7%, followed by natural gas at 37.5%. However, the modeled economic impact varied by utility type because the consequences associated with each type of infrastructure differ.
The same principle applies at the individual utility level.
A location with frequent, relatively low-consequence incidents may require one response. An area with fewer incidents but critical infrastructure and greater potential for service or safety consequences may require another.
This leaves utility leaders with two important questions: Where do damages happen most often, and where would a damage matter most?
Location is part of that equation. CGA estimates that urban incidents account for 89.2% of its modeled economic impact. Mapping damage activity alongside ticket volume, construction activity or critical infrastructure can help utilities determine where additional quality assurance, field verification, or watch and protect support may provide the greatest value.
Don’t Overlook Everyday Incidents
Some of the most useful information in CGA’s report isn’t about catastrophic events.
The analysis estimates that moderate incidents represent 77.5% of total modeled economic impact, compared with 18% for minor incidents, and 4.5% for major incidents.
High-consequence incidents understandably receive significant attention. But more routine incidents can reveal systemic issues before they contribute to something more serious.
Repeated misses, recurring communication problems or similar field conditions shouldn’t become accepted as the normal cost of doing business. Individually, they may seem manageable. Collectively, they may point toward an opportunity for improvement.
Turn Lessons Learned Into Action
Identifying a pattern is only valuable if something changes because of it.
If damages cluster around a particular project type, additional coordination may be warranted. If incidents increase alongside ticket volume, staffing, or workload may deserve closer examination. If certain locations repeatedly experience issues, additional field verification or watch and protect support may be appropriate.
Other patterns may point toward targeted training, stronger quality assurance, improved documentation, or better communication among stakeholders.
The specific response will vary. The important part is creating a feedback loop between what happens in the field and how the organization responds.
Ask Better Questions of Your Damage Data
Damage counts will always have a place in measuring performance, but they should be the beginning of the conversation, not the end.
The goal isn’t necessarily more data. It’s asking better questions of the information utilities already have.
Where are our greatest risks? What patterns are we seeing? What can we address before it happens again? Where can our resources have the greatest impact?
When damage data starts answering those questions, it becomes more than a record of past performance. It becomes a tool for preventing what happens next.
Turn Damage Data Into Prevention
Effective damage prevention combines experienced field personnel with the information needed to make informed decisions. Bermex partners with utilities to provide line locating, watch and protect, emergency response and other damage prevention services that help protect critical infrastructure and support safe, reliable operations.
Learn more about Bermex’s damage prevention services and how our experienced teams can help strengthen your approach to protecting underground infrastructure.